|
The global statistics are used for the evaluation of views, downloads, logins, traffic and disk space. Authorised users can put together individual statistic reports and export these if required.
 Statistic Windows Statistic Windows
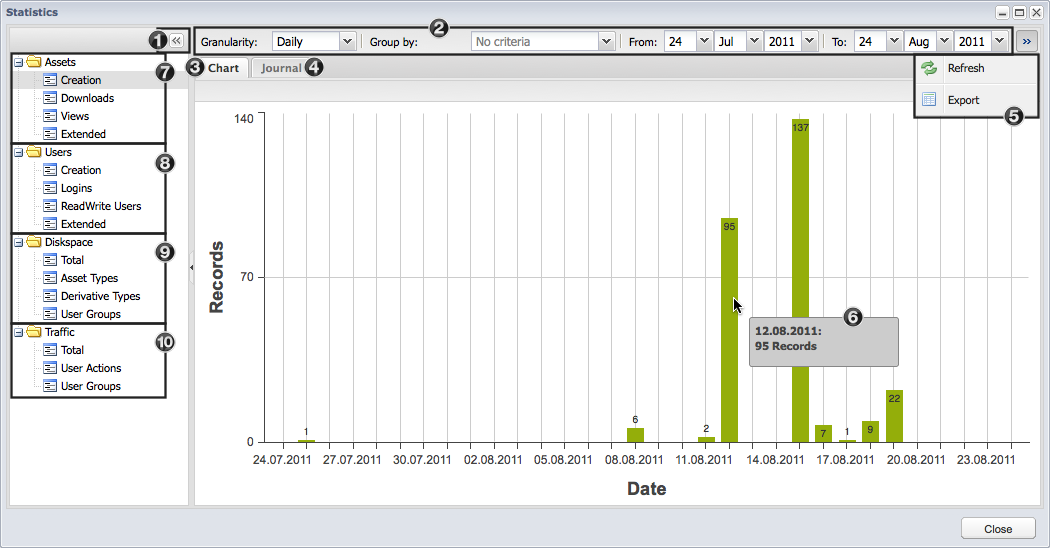
The desired data can be selected in the left pane of the window. These are then displayed in the right pane and can be filtered.

- To increase the right hand size you can use the arrows to collapse the left hand side
- You can filter the selected data using the different filters
- The data are displayed as diagrams in the statistic tab
- The data can be listed in the journal tab by stating an action or size amongst other options.
- The filtered data can be refreshed or filtered in the menu
- A tooltip with more detailed information to the data is shown when you mouse over a bar in the chart
- The asset statistics provide information on the creation of new assets, downloads of derivatives and asset views
- The user statistics provide information on the creation of new users, the logins of all users, as well as the number of ReadWrite users in the system.
- The disk space statistics show how much total disk space and how much disk space is used for the different asset types, derivative types and user groups
- The traffic statistics provide information over the total data transferred and show the division of traffic into individual actions and user groups
|
 Filtering the View Filtering the View
It is possible to use filters on the statistic data. This facilitates the evaluation of the data.

- Selection of the time frame for which the data should be returned (daily, monthly or yearly)
- Selection of the criteria by which the data should be grouped. There are different criteria available depending on the statistic. .
- Date selection
- To apply the filter you need to click on refresh after each change
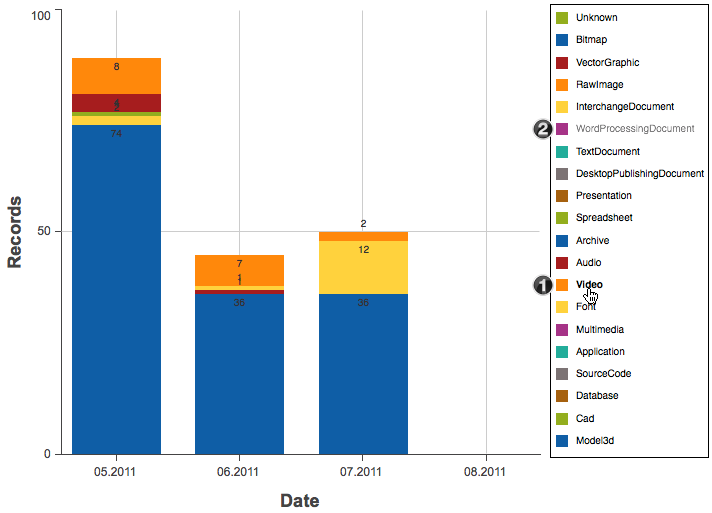
If a grouping criterion (see 2 above) was selected, a legend appears next to the chart. With a single click (1) on an entry the data are hidden in the diagram and the entry appears gray (2).

|
|


